
The Ill-Defined Space Spacecraft Market and Service Analysis, Pt. 1: 2024
This is an analysis of 2024 spacecraft deployments. For a summary and number of deployments, please read “The Ill-Defined Space Spacecraft Deployment Summary: 2024.” That summary contains spacecraft deployment estimates from various nations and companies worldwide. This analysis delves into the markets served and the services and payloads various spacecraft operators deployed.
Starlink Overwhelms the Charts
The following treemap covers 2024 and shows the overall shares of nations and their spacecraft operators, the share of markets they cater to (civil, commercial, or military), and the share of satellites providing services, such as communications, remote sensing, navigation, etc.
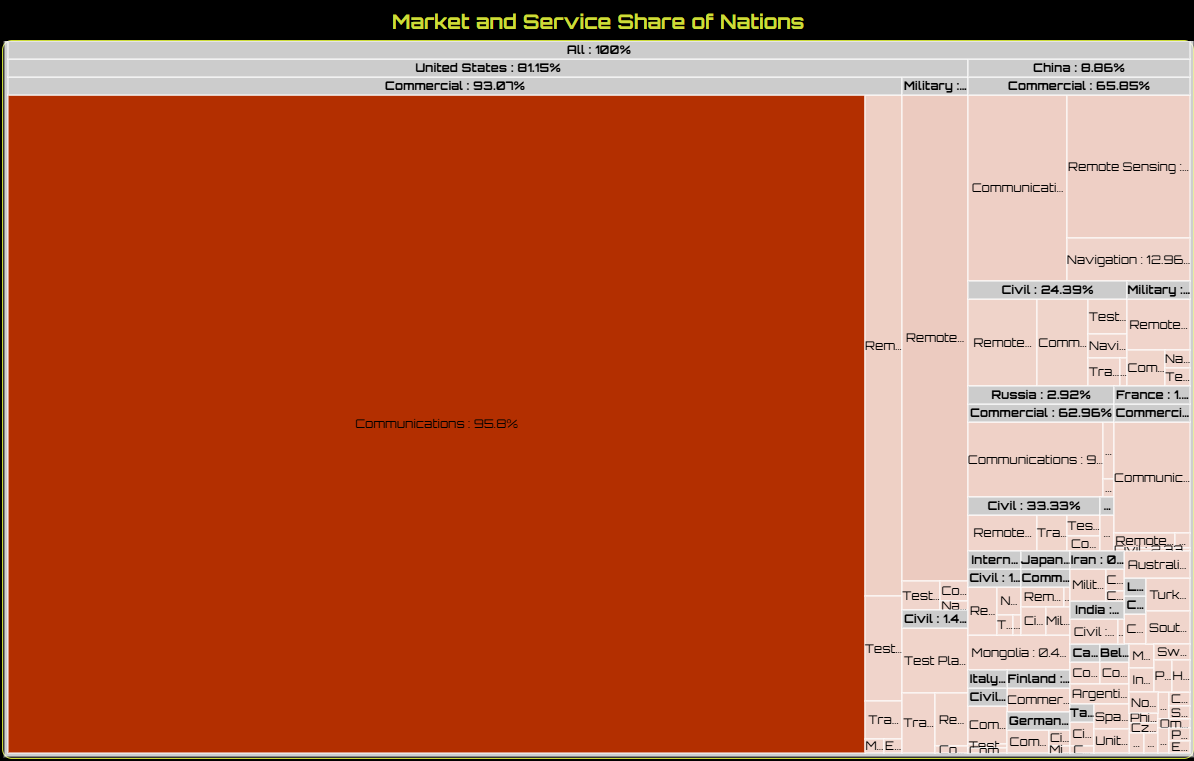
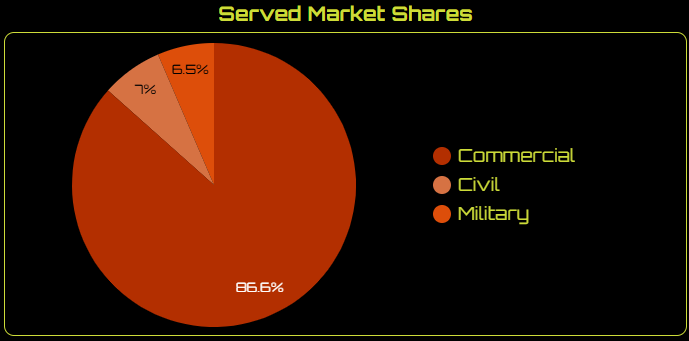
The percentages refer to the 2024 spacecraft deployments (an estimated 2,807). It includes Starlink satellite deployments (Starlinks are a type of communications satellite–internet relay, specifically), which obscures much of the service shares from other spacecraft operators. Similarly, the shares of spacecraft serving the three markets topple towards the commercial side of things thanks to Starlink. Civil and military markets each had less than 10% of deployed spacecraft serving them in 2024.
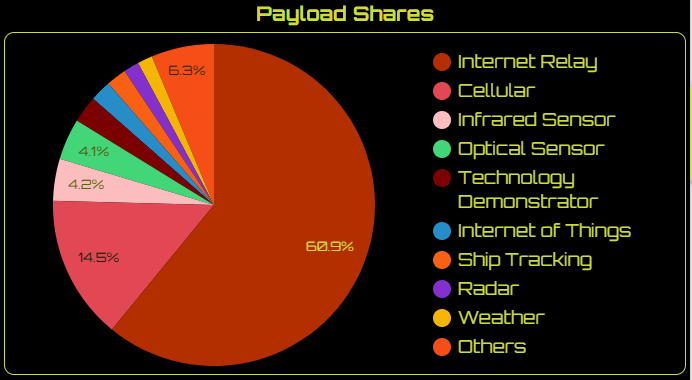
The dominant payload category of all spacecraft in 2024 was, since Starlink was involved, internet relay. Again, thanks to Starlink, satellites with cellular communications capability took the second-highest of deployed payload shares. Remote sensing payloads, such as optical and infrared (maybe), were nearly tied for third in payload shares.
Excluding Starlink for Clarity
Excluding the Starlink satellites from the treemap results in something more readable.
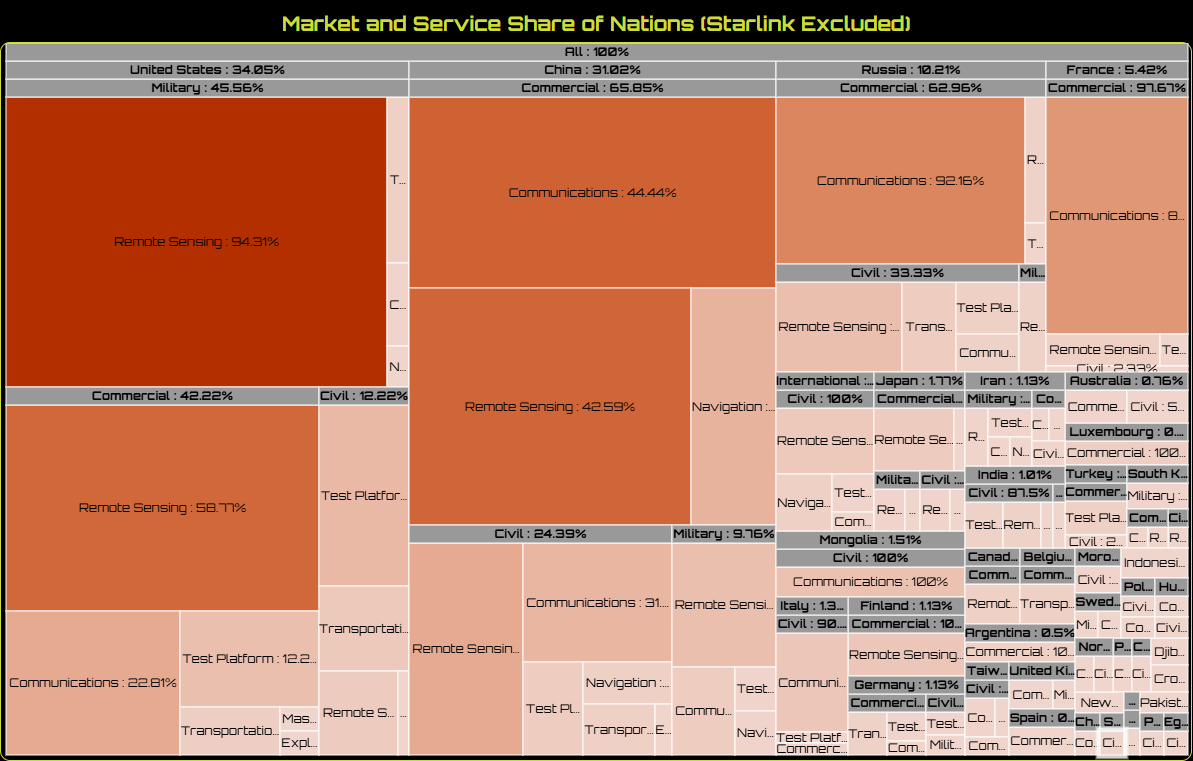
The result covers ~819 spacecraft. It’s still a bit obscured when it gets to around 5%. The nations with companies and organizations operating spacecraft that provide the most share of services (above 5%) in 2024 are the United States (~34%), China (~31%), Russia (~10%), and France (~5%). The subsequent analysis will go a little deeper into their shares, but before doing so, reviewing the market and payload trends for 2024 is helpful.
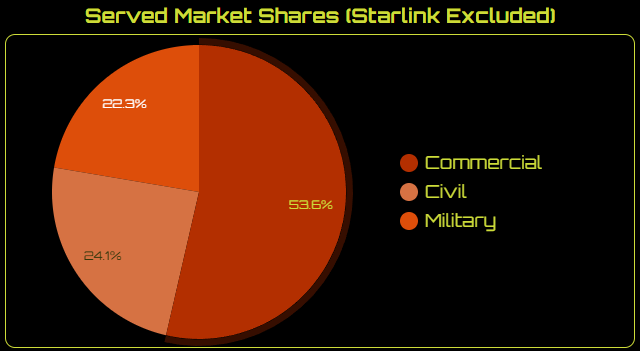
Once Starlink was excluded, the number of spacecraft serving civil and military markets remained the same. Their shares, while more significant, remained close to each other. However, over 50% of spacecraft deployed in 2024 aimed to provide commercial services.
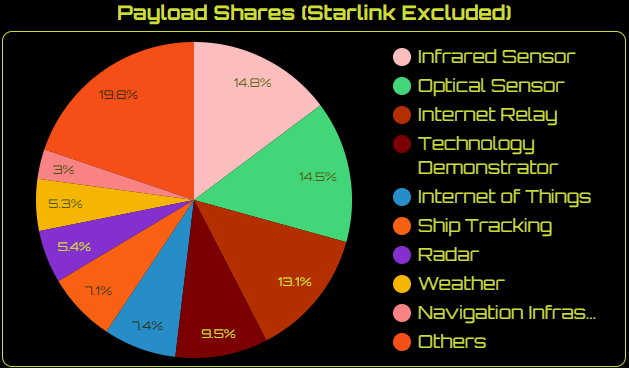
Satellites using infrared and optical sensors were nearly equal in deployed numbers. Internet relay satellites, specifically those from China, almost gained an equal share of infrared and optical satellites. Technology demonstration satellites for various operators also had a significant share–nearly 10%—showing continued interest from companies in testing various payloads and ideas—enough interest to invest resources in building and operating a satellite.
To be very clear, the high share of infrared sensors might be inaccurate. That’s because it’s based on a guess about the type of payloads the National Reconnaissance Office (NRO) uses on its Starshield-based satellites. That organization could just as easily use multispectral or hyperspectral payloads or a combination of sensors. All of these would help the NRO in its mission.
The kinds of payloads deployed on spacecraft are perhaps unsurprising. Many companies have embraced remote sensing payloads, especially optical, to provide services. Communications payloads on low-Earth orbiting satellites comprised 13% of all spacecraft deployed in 2024. If Kuiper and the internet relay satellite companies from China start deploying more in 2025, the number of satellites dedicated to the communications market will grow. Kuiper will compete with Starlink, but the companies from China will not.
Overall, companies using satellite payloads other than optical sensors or communications suites have more room for growth. Note that satellite tugs and other mobility spacecraft have no significant share. Commercially offered PNT services also have a low satellite share (probably because they compete against free services from various nations). The low numbers for those types of services and payloads indicate more opportunities.
When exploring the details of spacecraft deployed from the U.S., China, Russia, and France, we may see some other trends. The data contains a little surprise, as hinted at in the charts above.
I will present that examination in the following analysis.
Of course, this is just for 2024. Also, there’s more information behind these trends than just the numbers. If you’re interested in a consultation, please contact me through LinkedIn.
If you liked this analysis (or any others from Ill-Defined Space), please share it. I also appreciate any donations (I like taking my family out every now and then). For the subscribers who have donated—THANK YOU from me and my family!!
Either or neither, please feel free to share this post!


Comments ()